Global EN
Sander Boleij
Associate Director – Sustainable Finance , The Netherlands
Consulting
New European sustainability laws aim, among other things, to make financial institutions’ sustainability disclosures more comparable. Customers and other stakeholders could then easily factor this information into their decision making. This is the idea. But what is the reality?
Over the past five years, the number of sustainability laws and regulations for the financial sector has risen sharply. After NFRD in 2018, P3ESG, Taxonomy and SFRD are currently being implemented. CSRD, ESRS and CSDDD are in the queue to be launched.
In a nutshell, the aim of many of these laws is for financial institutions to embrace a single harmonised (European) definition of sustainability, and report in a harmonised manner on all relevant aspects of their own sustainability policies, risks and outcomes. This way, customers and other stakeholders will obtain more comparable information, and thus be able to make more informed sustainability choices. Of course, that’s the idea.
For banks, the new laws have posed many challenges in recent years. Not only has the interpretation of these laws proven difficult, but their implementation has not come naturally either. Many definitions used in the law proved unclear and much of the data to be included in the reports did not yet exist. Nevertheless, the implementation of the first laws is now so far advanced that the outside world can take note of the results, as evidenced through the extensive reports published by financial institutions in the first months of 2023.
The question now is whether these new reports make it easier to compare financial institutions. We took the test and examined the four largest Dutch banks on the physical climate risks of their mortgages, using one of these new publications.
From 2023, financial institutions will be asked, under P3ESG (an extension of the long-standing P3), to indicate the extent to which their loans and investments are susceptible to physical damage due to climate change. This mainly concerns exposures in nine prescribed economic sectors and mortgages (defined in P3ESG as ‘loans collateralised by residential and commercial immovable property’).
Financial institutions are expected to indicate what percentage of their exposures are sensitive to three types of physical climate risks:
P3ESG does not contain a mandatorily prescribed method for arriving at these risk estimates, but it does contain suggestions.
The table below shows how the four Dutch banks have now complied with said P3ESG reporting obligations, as far as their mortgage portfolios are concerned.
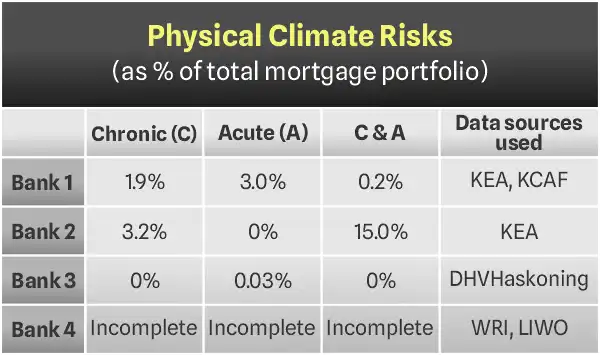
This table suggests that the physical climate risks in banks' mortgage portfolios can vary to as much as 15 percentage points. That is quite surprising.
Of course, mortgage portfolios can certainly differ between banks. For instance, one bank financed more homes in cities while another bank financed more in rural areas. There are also differences in market segments, for instance, banks that mainly finance mortgages for wealthy individuals, in the more expensive housing segment. But are there also banks that, in line with the suggestion from the table, have financed above-average numbers of homes in flood zones? Or, in areas where storms are more frequent? That does not seem very plausible to us -- in a small country like the Netherlands -- at first glance.
Fortunately, these four banks have not only published their risk figures but have also attached an explanation from which it can be seen how they arrived at these figures. Based on these explanations, it is possible to better understand some of the differences between the banks shown in the table.
For instance, the first bank's explanation shows that it used KCAF data to calculate chronic risks. These data show that chronic physical climate risks are mainly subsidence of properties, which occurs due to low groundwater levels. Using this data, Bank 1 calculated that 1.9% of its portfolio could be affected. Using data from another source, the ‘Klimaat Effect Atlas’ (KEA), Bank 1 has calculated that acute physical climate risks for private mortgages affect 3% of the portfolio. These acute risks are related to floods and wildfires. In the notes to the table, the bank does mention that the calculation of acute risks assumes that the Dutch government's Delta Programme (including, e.g., dyke reinforcements and river widenings) will be successfully continued in the coming years. On the third reportable physical risk category, 'simultaneous impacts' (chronic and acute), the bank states that these are very small: 0.2%.
The second bank also appears to have used KEA data to calculate acute risks. But, unlike Bank 1, Bank 2 also used this data to calculate chronic risks. Bank 2 concludes that chronic risks in its mortgage portfolio are over 3%, acute 0%, and simultaneous risks (chronic and acute) are 15%. The question that now arises is whether the results of Bank 1 and Bank 2 can be properly compared.
For comparing acute risks, the answer initially seems to be 'yes'. After all, both banks used the same data source and, according to their explanations, also used the same flood scenario (flooding > 50 cm; probability 1/300 years).
Nevertheless, there are at least three reasons to be cautious when comparing the results of the two banks:
"Comparing physical risks reported by banks is difficult, even when banks have largely used the same data source."
For chronic physical risks, comparing the results of Bank 1 and Bank 2 seems even more difficult. This is because here both banks used different data providers (KCAF versus KEA). And because each provider uses its own methodology, with its own scenarios (for example, temperature trends and droughts), its own definitions and its own thresholds, comparing results here does not seem sensible.
For Bank 3, the above conclusion that comparing results between banks becomes difficult if they base themselves on different sources, seems even more valid. Indeed, this bank bases its calculations on an entirely different dataset, from DHVHaskoning, and draws the conclusion for its Dutch mortgage collateral that it would not be at all sensitive to acute, chronic or simultaneous physical climate risks. This is a remarkable conclusion, not only in the light of Bank 1 and Bank 2's reports, but also because we have no reason to believe that Bank 3's mortgage portfolio is materially different from those of the other two banks (e.g., would be completely outside potential flood zones).
“The chosen data source appears to be highly determinant of the nature and magnitude of reported physical climate risks.”
Finally, Bank 4 has been excluded from our analysis as this Dutch bank did not include private mortgages in the P3ESG publication in question, but only business loans with a home as collateral. This made its figures no longer comparable with those of the other banks. Note: this bank's publication seems to confirm our earlier contention that banks are struggling to interpret the legislation correctly.
In summary, the conclusion seems to be that the physical climate risks calculated by the banks are difficult to compare so far, mainly due to the use of different datasets and methodologies. The goal of the new EU sustainability laws to make banks' sustainability data more comparable has thus not yet been achieved in this respect. But this does not mean that this goal cannot be achieved.
We expect that the observed differences in banks' reporting (especially with regard to data and methodologies used) will start to decrease in the coming years. The driver of this further harmonisation will not only be market forces; regulators are also likely to give financial institutions more direction than they have done so far.

Associate Director, Synechron, Netherlands
As Associate Director, and a Sustainable Finance expert with Synechron the Netherlands, Sander advises financial institutions on their sustainability challenges. Recent examples center around the implementation of new sustainability legislations, the calculation of physical climate risks and the efficient management of ESG data by using innovative technologies.
Contact the author at: sander.boleij@synechron.com
 Australia
  Canada
  Canada
  France
  Hong Kong
  India
India  Japan
Japan  Luxembourg
  Saudi Arabia
  Serbia
  Singapore
  Switzerland
  The Netherlands
  United Arab Emirates
  United Kingdom
  United States